Painting cells, zooming in, and exploring in 3D
Dr. Stefani studies cell membranes, which separate the insides of cells from the outside world. She aims to learn how germs infect cells and how cells repair themselves.
“Cells can’t see, they can’t smell. Yet they respond differently to different invaders,” she says. “Sometimes, when cells are infected with bacteria, they yell and scream and call in more immune cells to fight it off. Other times, they see cancer cells and don’t say a word, allowing tumors to grow. I want to know why.”
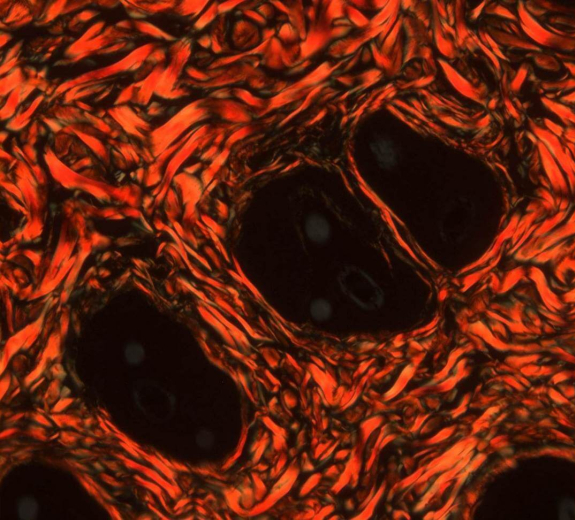
Dr. Stefani uses a technique called cell painting to apply different stains to cells. This enables her to find similarities, like cells that are the same shape or size. It also illuminates patterns, like cells that express the same genes or that are affected by a certain drug.
“It’s like looking at a big crowd and sorting out who is wearing glasses or who has blond hair,” she says.
Another tool called expansion microscopy lets her zoom way in on cells. This can make them up to 40 times their original size.
Finally, she uses a tool called Confocal VR, which she developed with Tom Skillman (BRI’s former head of research technology). This tool creates 3D images of those zoomed-in cells and allows you to explore them in VR.
“A flat image can tell us that a toxin entered a cell. The tool that Tom and I developed allows us to follow that toxin inside the cell and see what it’s doing,” she says.
Her team has already discovered a new gene that helps cells repair themselves. She hopes to study this gene in cancer, to see if it could explain why cancer sometimes comes back after treatment.
“The gene we found tells the cell ‘repair, repair, repair’ when it’s infected with a toxin,” Dr. Stefani says. “But if it says ‘repair, repair, repair’ in a cancer cell, does that enable the cancer to keep coming back? We’re putting together a grant application to find out.”
Using AI for faster, more accurate results
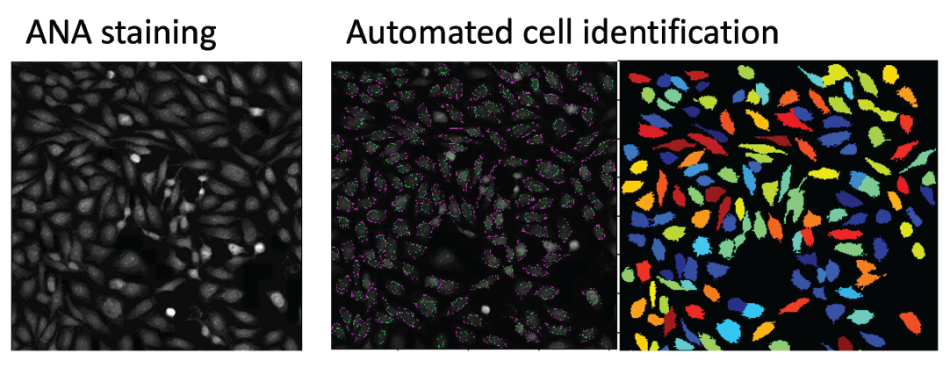
Antinuclear antibody (ANA) tests show whether a person has immune cells that attack healthy tissue. These tests can help diagnose diseases like lupus and multiple sclerosis. They are often used in research to find which immune cells are attacking healthy tissue. But each test needs to be read individually. And if a researcher collects hundreds of tests, it can take days to interpret every single one.
Dr. Stefani’s team is building AI software that could save scientists tons of time.
“Our software works like Google Photos, which can recognize people’s faces, know a cat is a cat and a dog is a dog,” says Dr. Stefani. “We teach the computer to recognize patterns across lots of images, then sort by shape, size and other features.”
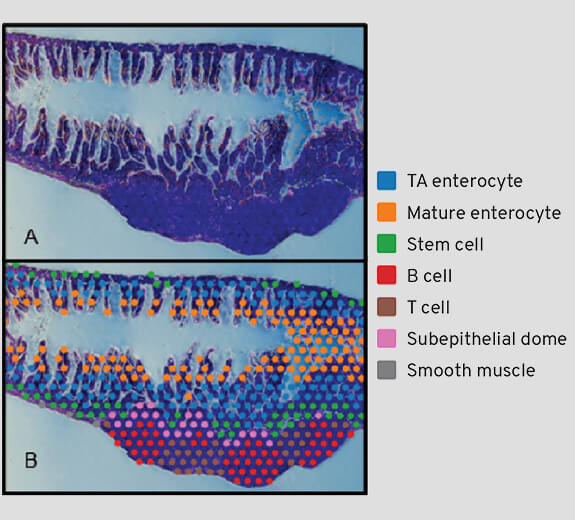
Current ANA tests only allow for one color stain, which shows just one type of immune cell attack. The platform will allow researchers to use different colors to identify different proteins, enabling scientists to extract more data from one sample. Dr. Stefani also plans to build this technology into an app that allows you to look for patterns across different samples, examining whether things like age, gender or race have an impact on disease.